Our previous study indicated that suburbs and small cities were clearly the winners of migration during the first year of the pandemic. With one in three adults working remotely and schools offering virtual learning, people sought out bigger houses with bigger yards for their kids to play in and office space for them to work. But, where do people move a year into the pandemic? Are suburbs and small cities gaining even more movers? As companies look beyond the pandemic, many are deciding whether to bring employees back to offices or allow them to work remotely and move away permanently.
Thus, to better understand the latest migration trends, we updated our analysis conducted last December using the United States Postal Service® change-of-address data. The current analysis covers relocations across the United States during the period January through June of 2021.
Findings
Overall, fewer people moved in the first half of 2021 compared to a year earlier. That’s normal. Remember that when the pandemic hit our country last March, millions of people "panic-moved," leaving their homes in urban centers. Nevertheless, people are no longer rushing to relocate due to the pandemic as millions of Americans are already vaccinated. Moreover, the current study responds to the question of whether or not people are permanently leaving their city homes. According to the data, it seems that people continue to move away from urban centers while small towns and rural areas attract even more movers.
Small towns gain even more people
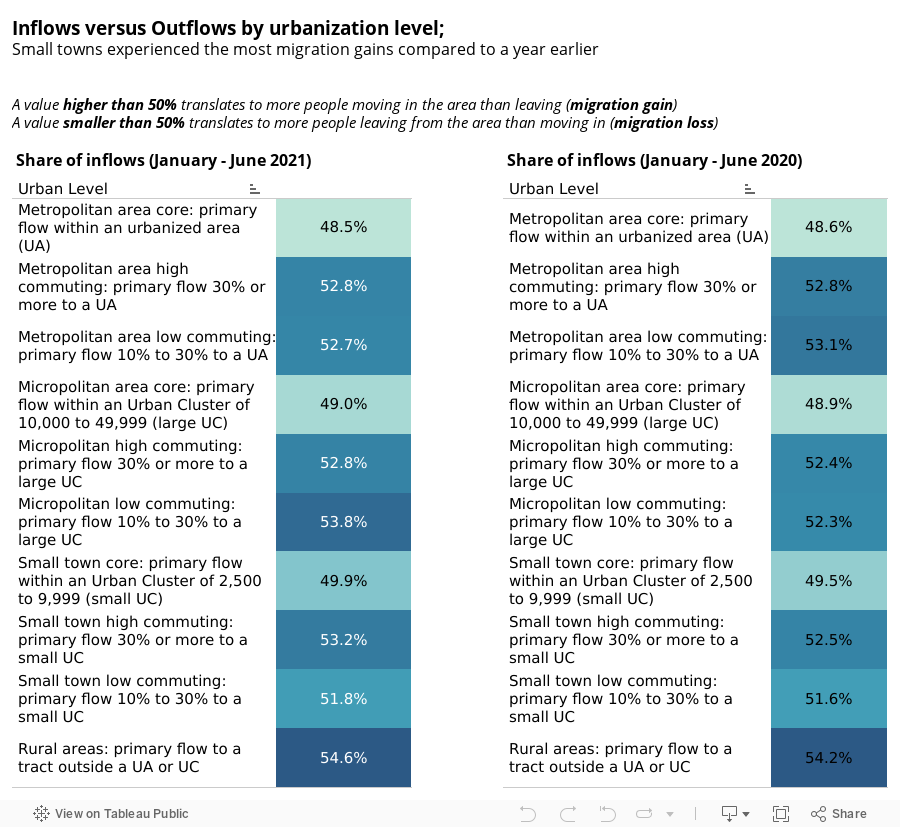
Net migration gains by urbanization level
Urban-rural differences in migration have always been analyzed, as they provide insight about potential population shifts across the country. Any evolving pattern of migratory behavior can have many policy implications for the country. There has been ample talk about people moving away from big cities and showing interest in less crowded areas. Indeed, even a year after the pandemic, people continue to move to small cities as many of them telework. The National Association of REALTORS® estimated the share of inbound moves by urbanization level.
To begin with, we are seeing that urban areas continue to lose people. A share of inbound moves lower than 50% translates to more people leaving than moving to the area for the specific period. According to the data, urban areas had more people moving out than in while the share of inbound moves fell even further in 2021 compared to a year earlier. Specifically, the share of inbound moves for urban areas was 48.5% in the first six months of 2021 compared to 48.6% during the same period a year earlier.
While more people are leaving urban areas, we are seeing that rural areas had the highest share of inbound moves in 2021 at 54.6% followed by micropolitan areas1 with a low commuting flow (53.8%) and small towns with a high commuting flow (53.2%). Meanwhile, micropolitan areas and small towns are gaining even more movers compared to a year earlier. Specifically, the share of inbound moves rose from 52.3% to 53.8% in micropolitan areas with low commuting flow; and, from 52.5% to 53.2% in small towns with high commuting flow. While home prices reach new record highs, affordability seems to be one of the primary motivations for this trend. A huge draw for these smaller towns is that the cost of housing consumes a much smaller chunk of people's salaries as they are able to find bigger homes for their families. See here how inbound compare to outbound moves by urbanization level:
Net migration gains by metropolitan level
After comparing inflows and outflows for each metropolitan area, we also identified the metro areas with the most migration gains in the first half of 2021. As the data shows, when people don’t move to more affordable areas, they choose to move to a home near the ocean or with a nice mountain view. For instance, Barnstable Town – one of the top vacation home areas - had 63% inbound moves although the median home price is $570,000. The same with the Portland metro area in Maine.

We also compared the inbound moves in the first half of 2021 with those of a year earlier. We actually are seeing that big cities such as New York, San Francisco, and Boston were among the areas with the most year-over-year inbound gains. Nevertheless, bear in mind that a year earlier people were fleeing from these big cities due to the pandemic. Thus, year-over-year comparisons of inbound moves may be a misleading indicator for migration trends due to the base effect as a relatively smaller number of people moved to these areas last year. Apparently, as many companies have already required their employees to go back to the office, more people are moving back to big cities.
We went one step further and analyzed where families, individuals and also businesses are moving in 2021. What did we find? As expected, families favor small cities versus individuals who are moving to urban centers.
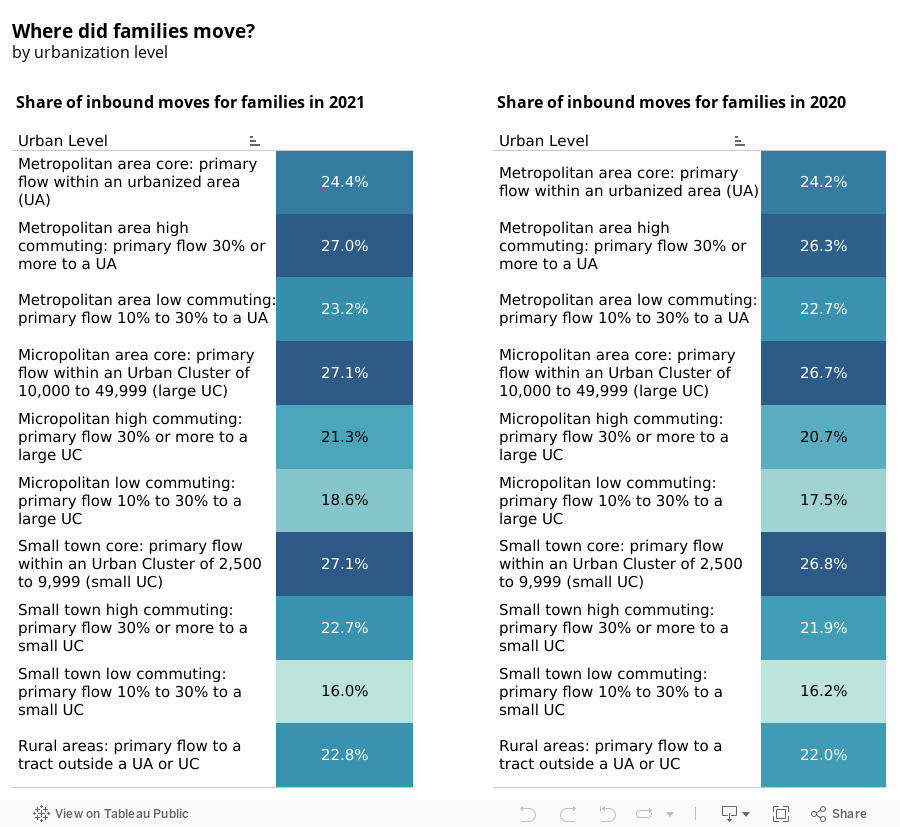
Families moved to small cities
Nearly 30% of the inbound moves in small towns and micropolitan centers made by a family compared to 24% in metropolitan areas. Meanwhile, rural areas are attracting more families as the share of inbound moves rose to 22.8% in 2021 from 22.0% a year earlier.
At the local level, Florida seems to be the favorite destination for families, areas such as Naples, Cape Coral and Sarasota. Among the following metro areas, more than 30% of the inbound moves came from families. While 62% of homebuyers are married couples,2 this has many implications about the local real estate market. To put it simply, the following areas are expected to see an uptick of home sales as people typically buy a home when they start a family because they want to raise their kids in a stable and safe environment. The good news is that construction is picking up with most of these areas building more homes than in the last 20 years. For instance, in the Sarasota, FL metro area, they are currently issuing twice the single-family building permits that they issued on average in the last 20 years. In the Provo Orem, UT metro area the number of single-family building permits is 150% above the historical average. As a result, these areas are more affordable with great opportunities for families to purchase a home.

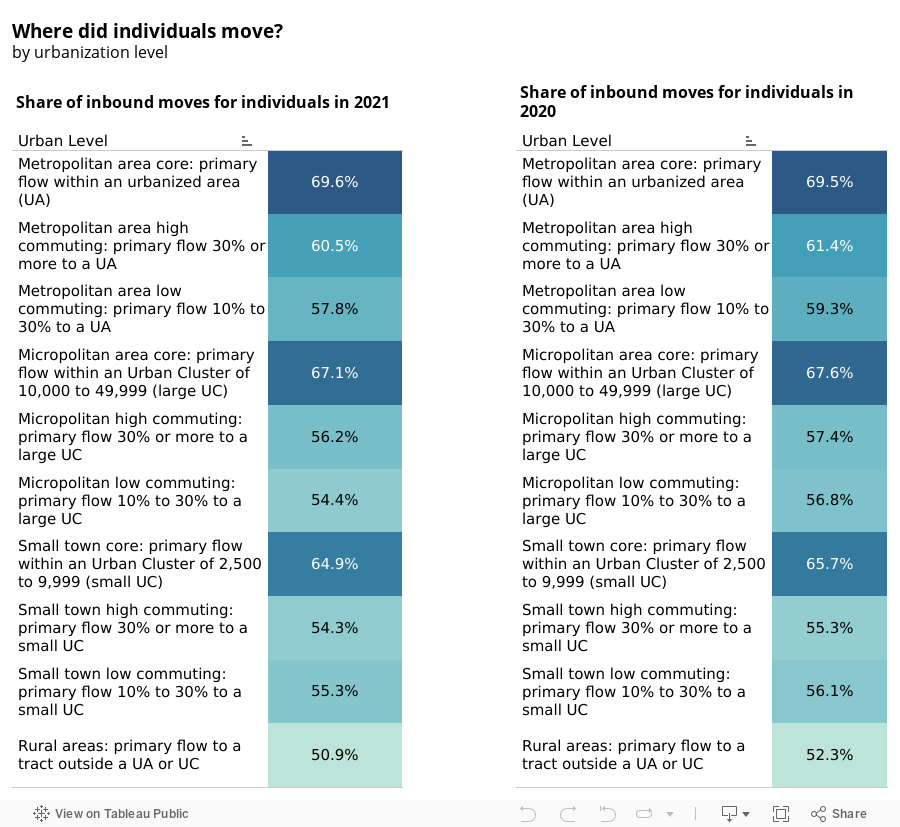
Individuals moved to large metropolitan areas
As the data shows, 70% of the inbound movers in urban centers were individuals, while fewer individuals moved to a smaller city in the first half of 2021 compared to the same period in 2020. The table below shows the share of inbound moves for individuals by urbanization level. We are seeing that their share dropped in every area which is smaller or with a lower commuting flow than an urban area. Thus, urban centers are still the most attractive areas for individuals.
At the local level, San Francisco, Denver, Seattle, and San Jose were some of the most popular destinations for individuals. In the following large metro areas, more than 70% of the inbound movers were individuals. As homebuyers need to spend more than $5,000 every month for their home loan in San Francisco and San Jose, families who are priced out from these markets are moving to more affordable areas.

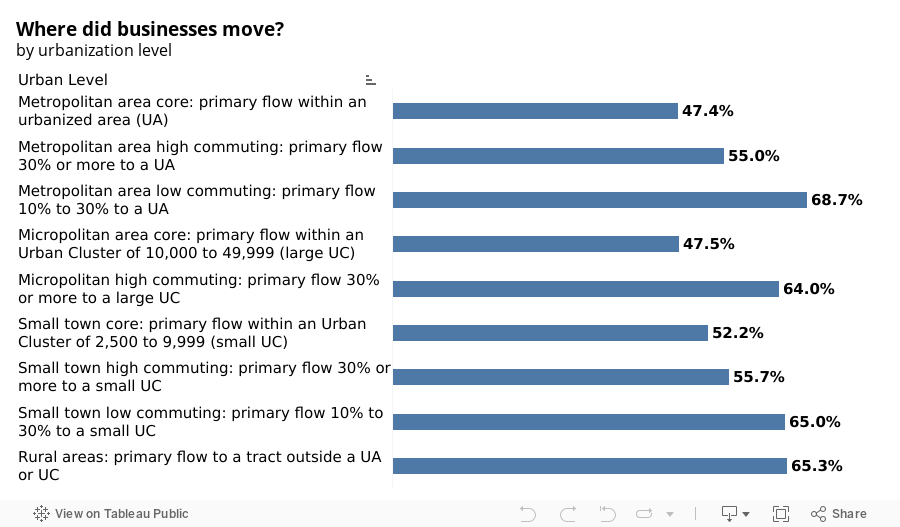
Businesses moved away from urban centers
As people move to suburbs and small cities, businesses do too. After comparing inflows and outflows for businesses by urbanization level, we are seeing that urban centers experienced migration losses. This means that more businesses decided to move out from an urban center than to move in.
This urban-rural migration trend has undoubtedly had an impact on businesses across the country. Since a large number of office workers continue to telework and move away from urban centers, there is a significant decrease in traffic to downtown business areas. Restaurants and shops who serve downtown workers still report a decline in customers. As a result, many of these businesses decided to move away from downtowns and relocate to suburbs and rural areas. According to the data, the share of inbound moves of businesses was 47% in urban centers compared to 65% in small towns and rural areas. With both residents and businesses moving out of the urban areas, it seems that new business opportunities will present themselves in small and rural areas.
At the local level, we are seeing that most businesses moved to North Carolina, South Carolina, Ohio, Nebraska, Florida, Connecticut, and Tennessee. It seems that business owners decided to relocate to areas where there is a low cost of living and a corporate–friendly tax structure that could help them save money post-pandemic. In the meantime, for example, Charlotte, NC; Jacksonville, FL; and Riverside, CA are among the biggest financial centers across the country. As residents and businesses move to the following areas, expect local real estate activity to be even stronger this year.

While COVID-19 cases are currently rising due to the spread of Delta variant, people will likely continue to limit their social interactions, especially families with unvaccinated members. It would be very interesting to see how this urban-rural migration trend will evolve in the second half of 2021. Stay tuned.
1 According to the U.S. Census, each micropolitan statistical area must have at least one urban cluster of at least 10,000 but less than 50,000 population.
2 2021 Profile of Home Buyers and Sellers Survey, NAR